
Case Study: How I Improved Frontend Page Speed
Hi, I’m a self-taught backend developer with 3+ years of experience, currently working at a tech startup based in The Bahamas. I mostly work with Python and Django, building APIs, designing database models, and improving performance when needed. I enjoy learning new tools and technologies as projects require.
Our landing page was visually strong, but the frontend was shipping too much too early.
The biggest symptoms were:
A Google performance score around 60 on the landing page
A very large production bundle
Heavy CSS and font payloads
Too much non-critical work happening during initial load
This was the warning I getting from vite while running build command.
vite v6.4.1 building for production...
✓ 2527 modules transformed.
dist/index.html
(!) Some chunks are larger than 500 kB after minification. Consider:
- Using dynamic import() to code-split the application
- Use build.rollupOptions.output.manualChunks to improve chunking: https://rollupjs.org/configuration-options/#output-manualchunks
- Adjust chunk size limit for this warning via build.chunkSizeWarningLimit.
✓ built in 9.64s
This write-up focuses only on the frontend side. API performance was intentionally left out.
The Problem
From the original production build:
Main JS bundle: 1,841.83 kB minified
Main CSS bundle: 269.42 kB
Gzipped JS: 590.54 kB
Gzipped CSS: 61.27 kB
That meant the browser had to parse, download, and evaluate far more than the landing page actually needed.
Strategy
I kept the plan simple:
Reduce the critical path
Load only what the current page needs
Push non-essential work after first paint
Keep regressions low by changing loading strategy first, not rewriting features
What I Changed
1. Route-level code splitting
The landing page should not pay the cost of planner screens, task editing flows, integrations, and dashboard code.
I changed the app so major routes load on demand instead of being pulled into the first page load.
const routes = [
  { path: "/", component: () => import("...HomePage...") },
  { path: "/app", component: () => import("...WorkspaceView...") },
  { path: "/settings", component: () => import("...SettingsView...") },
];
2. Lazy-loading expensive UI inside authenticated screens
Even inside the app, some heavy UI only appears after user interaction.
Examples:
task edit modal
integration panels
filter sidebar
device-specific overlays
So instead of bundling them into the initial workspace render, I loaded them only when needed.
const HeavyModal = defineAsyncComponent(() => import("...TaskEditor..."));
you can read more about defineAsyncComponent on official docs.
3. Deferring analytics and monitoring
Analytics, session tracking, and error monitoring are useful, but they do not need to compete with first paint.
I moved them behind a delayed, idle-time startup.
runAfterLoadAndIdle(() => {
  setTimeout(() => {
    initAnalytics();
    initMonitoring();
    loadThirdPartyScript();
  }, 4000);
});
This was one of the highest-leverage changes for Lighthouse.
4. Font loading discipline
The previous build was shipping a wide set of font families and language subsets up front.
I changed that strategy to:
load only base fonts first
load landing-page accent fonts only on the landing page
load theme-specific fonts only when that theme is active
use narrower subsets instead of pulling everything by default
loadBaseFonts();
loadLandingFonts();
loadThemeFonts(currentTheme);
5. Reducing work on the landing page itself
The landing page also had runtime work that looked nice but did not need to happen immediately.
I optimized that by:
delaying visual effects until idle time
keeping below-the-fold sections out of the initial rendering cost
adding image dimensions to reduce layout work
preserving design while trimming early execution
Benchmarks
Build Footprint
| Metric | Before | After |
|---|---|---|
| Main landing-path JS | 1,841.83 kB | about 237 kB critical JS |
| Main landing-path CSS | 269.42 kB | about 24 kB critical CSS |
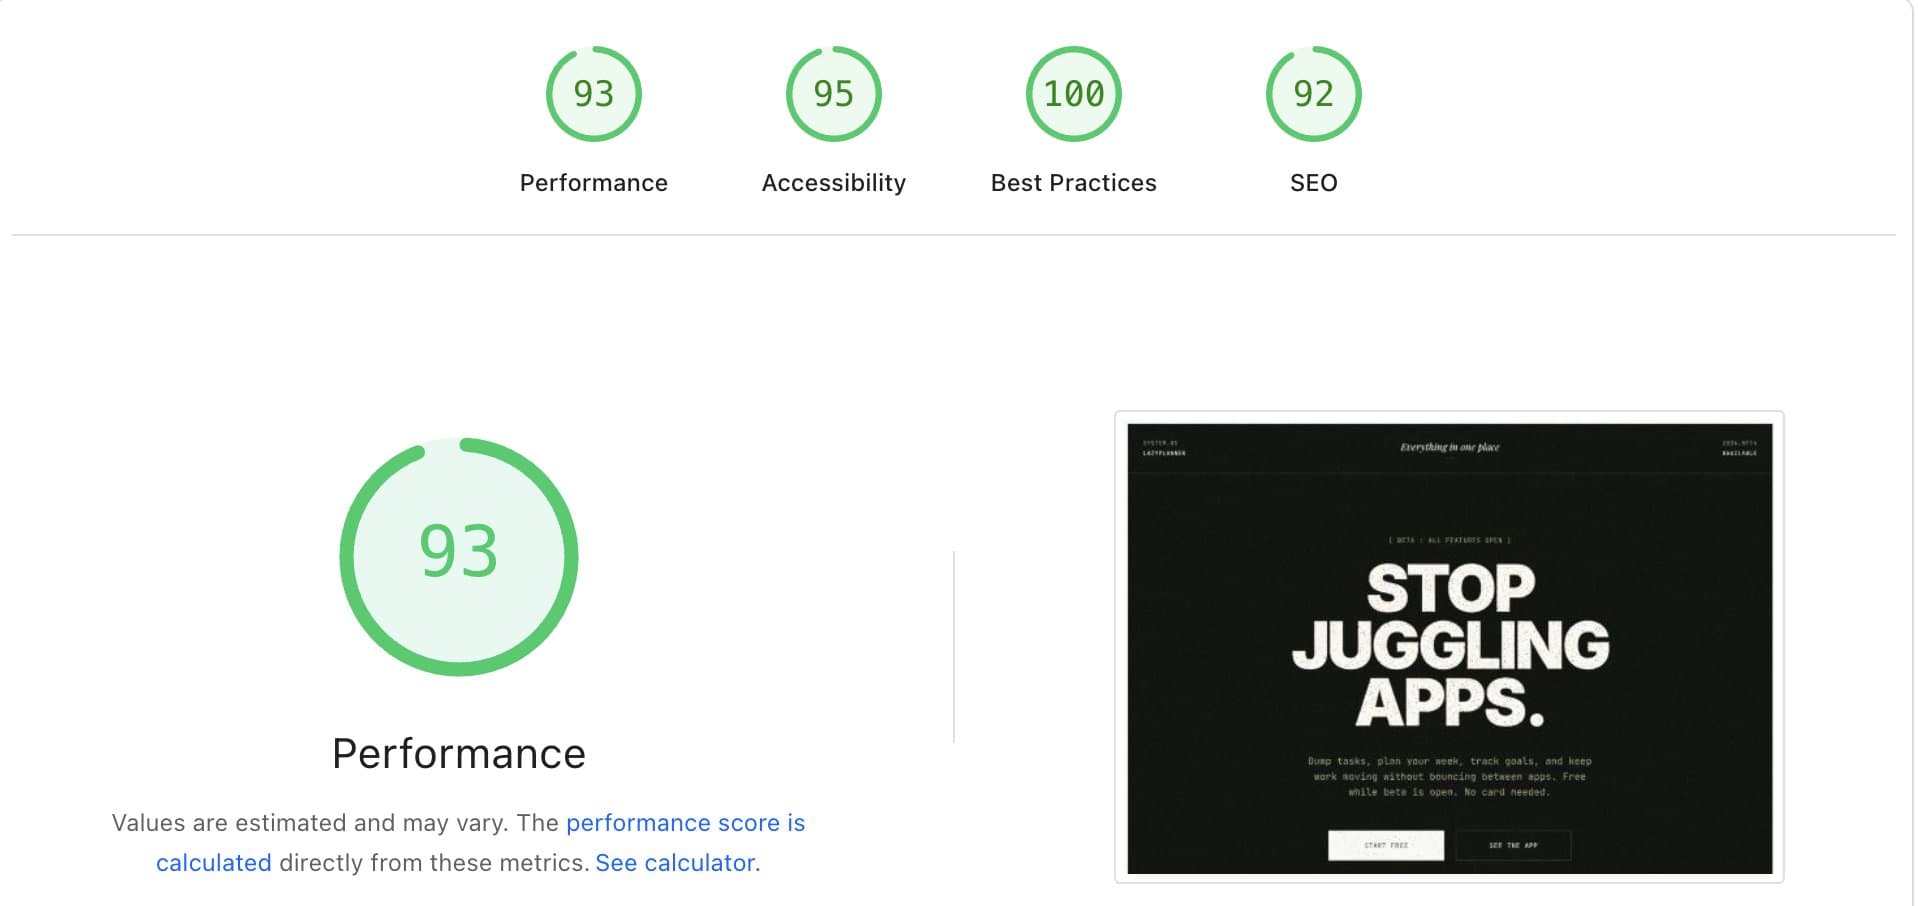
Lighthouse Snapshot
| Metric | Before | After |
|---|---|---|
| Landing page performance score | ~60 | 93 |
Notes:
The new JS number reflects the critical landing path, not the entire app footprint.
Large authenticated features still exist, but they are no longer loaded up front on the landing page.
Why This Worked
The biggest lesson was straightforward:
I did not need less product. I needed less product in the first request.
Most performance issues were not caused by one huge mistake. They came from many reasonable frontend decisions stacking together:
eager route imports
global loading of rare UI
early analytics boot
broad font loading
decorative runtime work too early
Once I treated the landing page like a focused entry experience instead of the whole app, performance improved quickly.
Takeaways
Start with the critical path, not micro-optimizations
Route splitting gives outsized wins when a landing page and app shell live together
Third-party scripts should earn their place in the first few seconds
Font strategy matters more than many teams think
Good performance work is often about loading order, not feature removal
Final Summary
I improved page speed by shrinking the initial frontend payload, deferring non-essential work, and keeping heavy product features out of the landing-page critical path.
The result was a much lighter first load, better rendering behavior, and a local Lighthouse score that moved from the low-performance range into the 90+ range without redesigning the product.
Before you go:
if you're someone struggling with managing time, then checkout this light weight but powerful web app Lazy Planner
i made this for myself first because i couldn't find the one that better suits my need but i believe if it's useful for me, it could be useful for more people too.